The pre-COVID 19 world no longer exists and was replaced by what is best described as scary times. Based on the push to reopen the economy and recent consumer behavior, it appears that society is coming to the conclusion that life must go on, signaling the beginning of the end of scary times. The world will not look like it did before this started nor will it go back. Systemic events have happened many times and it is easy to forget that these events forever shape business and consumer behavior. The terrorist attacks of 9/11 is a good example. Most forget the lasting changes that came from this event. Travel, personal identification verification and privacy, to name a few, were forever changed.
The market volatility and fear during this pandemic will create opportunity for those that can remove emotion and analyze what is going on. MBM’s Investment Committee has been hard at work to do just that. This has expedited a fundamental change that we have been analyzing for the last several years. Over the next month, there will be tactical improvements to MBM’s investment strategies to reposition investors for success in the new normal. Hang with us through this commentary. It is the longest we have released but it will provide insight into investing in the new COVID-19 world.
Before diving into the recent updates to MBM’s investment strategies, it important to review what has happened year-to-date and then put it into a historical perspective.
Year-to-Date Summary
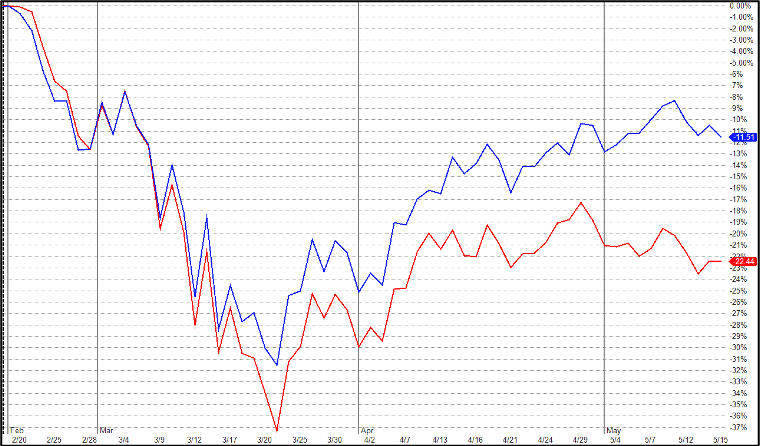
All leading and lagging economic indicators indicated the U.S., and to a lesser extent the global economy, were in full economic expansion as 2020 started. Although equity valuations were slightly elevated, they were still within acceptable ranges based on the growth the economy was experiencing. Two simultaneous Black Swan events, defined as an event that comes as a surprise, has a major effect, and is often inappropriately rationalized after the fact with the benefit of hindsight1, caused the S&P 500 to drop 30% from its record high on February 19th in only 22 trading days. This was the fastest stock market sell-off of this magnitude in history, including the decline during the Great Depression2. Many people look at the COVID-19 pandemic and believe that a large market sell off should have been predicted. Based on the table below, history would tell us otherwise. Contrary to current media coverage, global health pandemics occur frequently and while they create volatility, these events seem to rarely have a lasting impact on the market.
The S&P 500 Index Has Historically Recovered Quickly From Epidemics

In addition to the COVID-19 pandemic, Saudi Arabia and Russia became entrenched in a price war in March. Over a few weeks, US oil prices fell by 34%, crude oil fell by 26%, and Brent oil fell by 24%. The price war was triggered by a breakup in dialogue between the Organization of the Petroleum Exporting Countries (OPEC) and Russia over proposed oil-production cuts. Russia walked out of the agreement, leading to the fall of the OPEC+ alliance. The price war is also one of the major causes of the stock market crash.4
We do not believe the record-setting decline across the global equity and fixed income markets was predictable. Much of the price deterioration was fueled by extreme fear and geopolitical shock. During the quick and severe drop, MBM maintained discipline to the current strategy as trading on fear rarely leads to better results. This is because trading on fear is not fundamentally driven and therefore unpredictable. It also leads to an overselling of assets and non-efficient pricing. We believed both the equity and fixed income markets were quickly oversold and a bounce would be experienced. This belief was confirmed with a rapid recovery of most fixed income investments to precorrection prices and a 50% recovery of equity prices in a couple of weeks. The current decline in equity prices is more in line with what we believe should have happened.
Historical Perspective
Bear markets have occurred 12 times between January 1926 and March 2020, including our current one. Over this time, markets have been considered in bear territory for roughly 180 out of 1,131 months or 16% of the time. The average bear market lasts 1.3 years with a cumulative loss of -36%. Therefore, it is far more common for markets to be in bull territory. The average bull market lasts 6.6 years with a cumulative return of 339%.5
History tells us that the odds of positive returns when holding equity securities improves over a long-term investment horizon.
Probability of Positive Returns (6)

Short-term volatility, especially when it is extreme, can be unnerving and will make many investors want to move money to safety until more certainty is known. Although this may temporarily feel good, it brings up a problem. When do you get back in? Exiting the markets requires two correct decisions as you have to time getting out and back in correctly. Exiting or entering the market at the wrong time can have massive impacts on a portfolio.
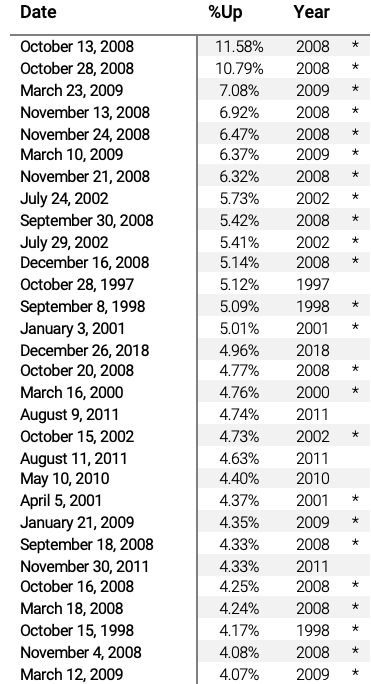
Unfortunately, the market’s best performance days often occur amid the worst times and missing any of these can be devastating to the portfolio’s long-term performance. The table on the right highlights individual high single-day returns of the market on some of its most positive days. Those with an orange highlight occurred during a period of market recession or downturn. It’s hard to imagine being panic-stricken to sell one day and then skillfully opportunistic enough to get back in and time any or all of these great days. In fact, this table would see several additional big ‘up’ days from the last few months of market volatility.
Based on the historical return of the S&P 500, if $10,000 was invested 12/31/1989, it would be worth $91,151 on 12/31/2019. The chart below shows how the performance of that hypothetical investment would change if you missed some of the S&P 500 Index’s best days; you can see the effect on the return would be drastic.
Best Days Missed Scenarios
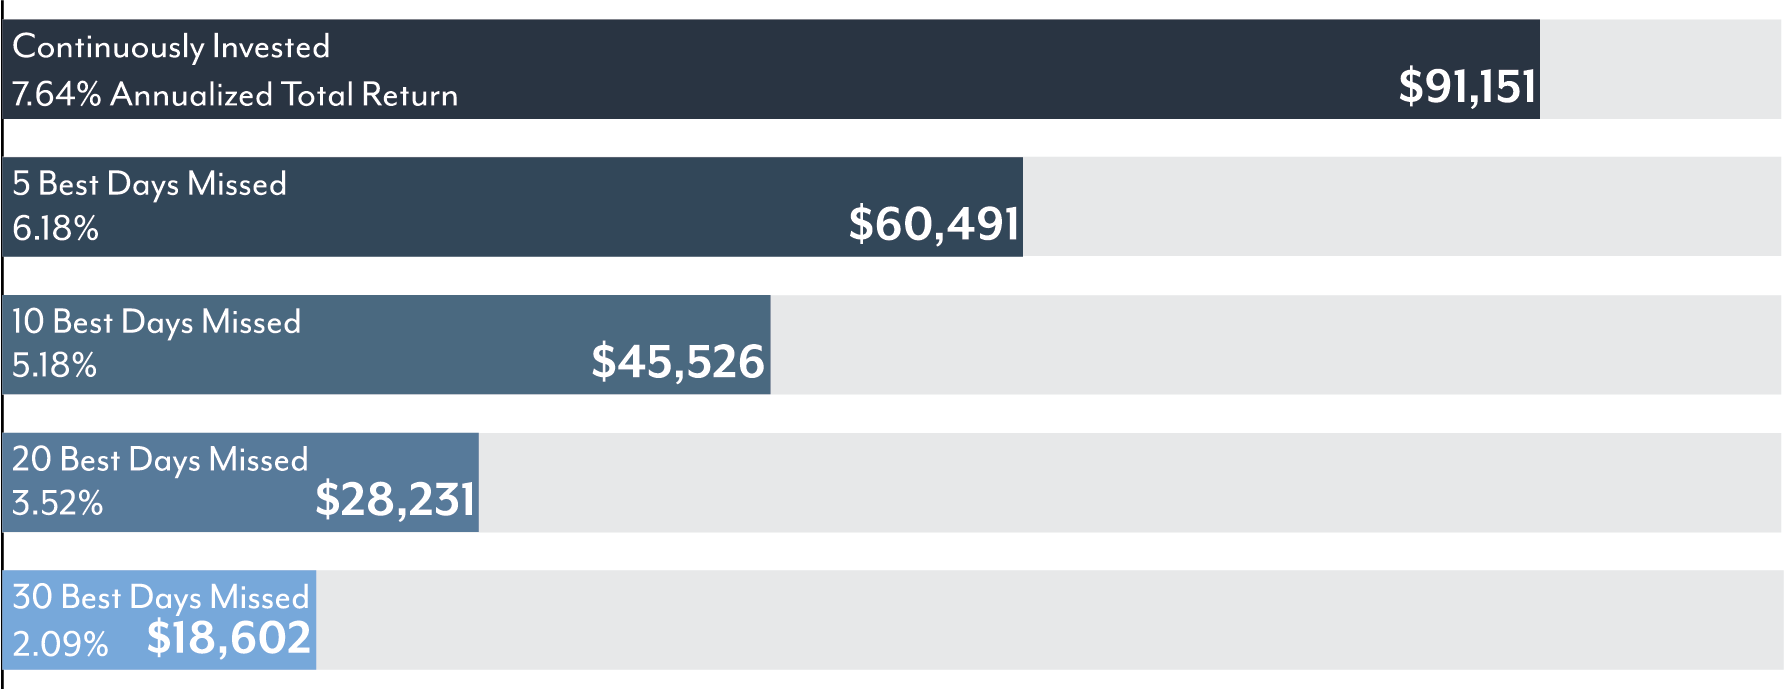
This investment behavior is part of what costs so many investors long term return.
Individual Investors vs. Indexes

State of the Economy
The response to the COVID-19 pandemic has been unprecedented and will have a severe effect on the U.S. economy. A fundamental shift in economic activity seems highly probable as some businesses will permanently close and survivors will be slow to rehire. Discretionary spending decreases during a recession, creating a self-fulfilling prophecy of a multi-quarter recovery. Furthermore, there is no certainty of when restrictions on economic activity will be removed. The number of COVID-19 cases will likely ebb and flow until herd immunity is developed, confirmed, or a vaccine is available. The response of governments and consumers to this new environment is unknown. Based on current assumptions, earnings are not projected to be positive until Q4 2020. This outlook could change based on additional economic shutdowns.
After 9/11, fear caused consumer and business spending to drop but the underlying financial strength of the economy eventually resurfaced as the fear subsided. In 2008, the financial world as we know it was in question, causing systemic shock to the economy, almost completely eroding the strength that had existed. It took extreme monetary and fiscal policy to reignite the economy, and much of those efforts were a gamble on if they’d be successful. In our evaluation, the current situation is more similar to the economic impact of 9/11 rather than the collapse we saw in 2008; however, a prolonged shut down or extended turmoil in the oil markets could lead us into a more “2008-like” scenario.
Unlike 2008, the U.S. and world governments were fairly quick to respond to COVID-19 with supportive measures and have stated the support would continue until the risks have subsided. Banks are also well capitalized comparatively, and in strong financial condition to continue lending to corporations and small businesses. These efforts will hopefully avert the risk of a “2008-like” scenario but there are still many unknowns associated with the virus and economic fallout.
In regard to the MBM Investment strategies discussed ahead, not all of them apply to all our clients, as these strategies are implemented on a portfolio-by-portfolio basis, depending upon individual risk tolerance and investment goals.
Taxable Fixed Income
Investment Grade Bonds
Interest rates have fallen significantly over the last 18 months. The 10-year Treasury, which is the most widely tracked benchmark of interest rates, has fallen 66% during this time. Bond prices are near an all-time high so the expected real return (return minus inflation) on government and corporate debt is expected to be negative over the next 3-5 years. Investment-grade bonds should be considered a hedge against market volatility and less as a source of return until interest rates normalize.
The average duration of investment-grade bonds was reduced across MBM’s portfolio strategies in early 2019. This was in response to the already low interest rate environment at the time. This action increased credit quality, or margin of safety, while minimally reducing the return expectation due to a flat yield curve. At this time, the strategy will continue to hold core positions of investment-grade, short-term bonds. Individual bonds will be added when attractive, providing the ability to capture a known return until maturity or call date that is not affected by rising interest rates.
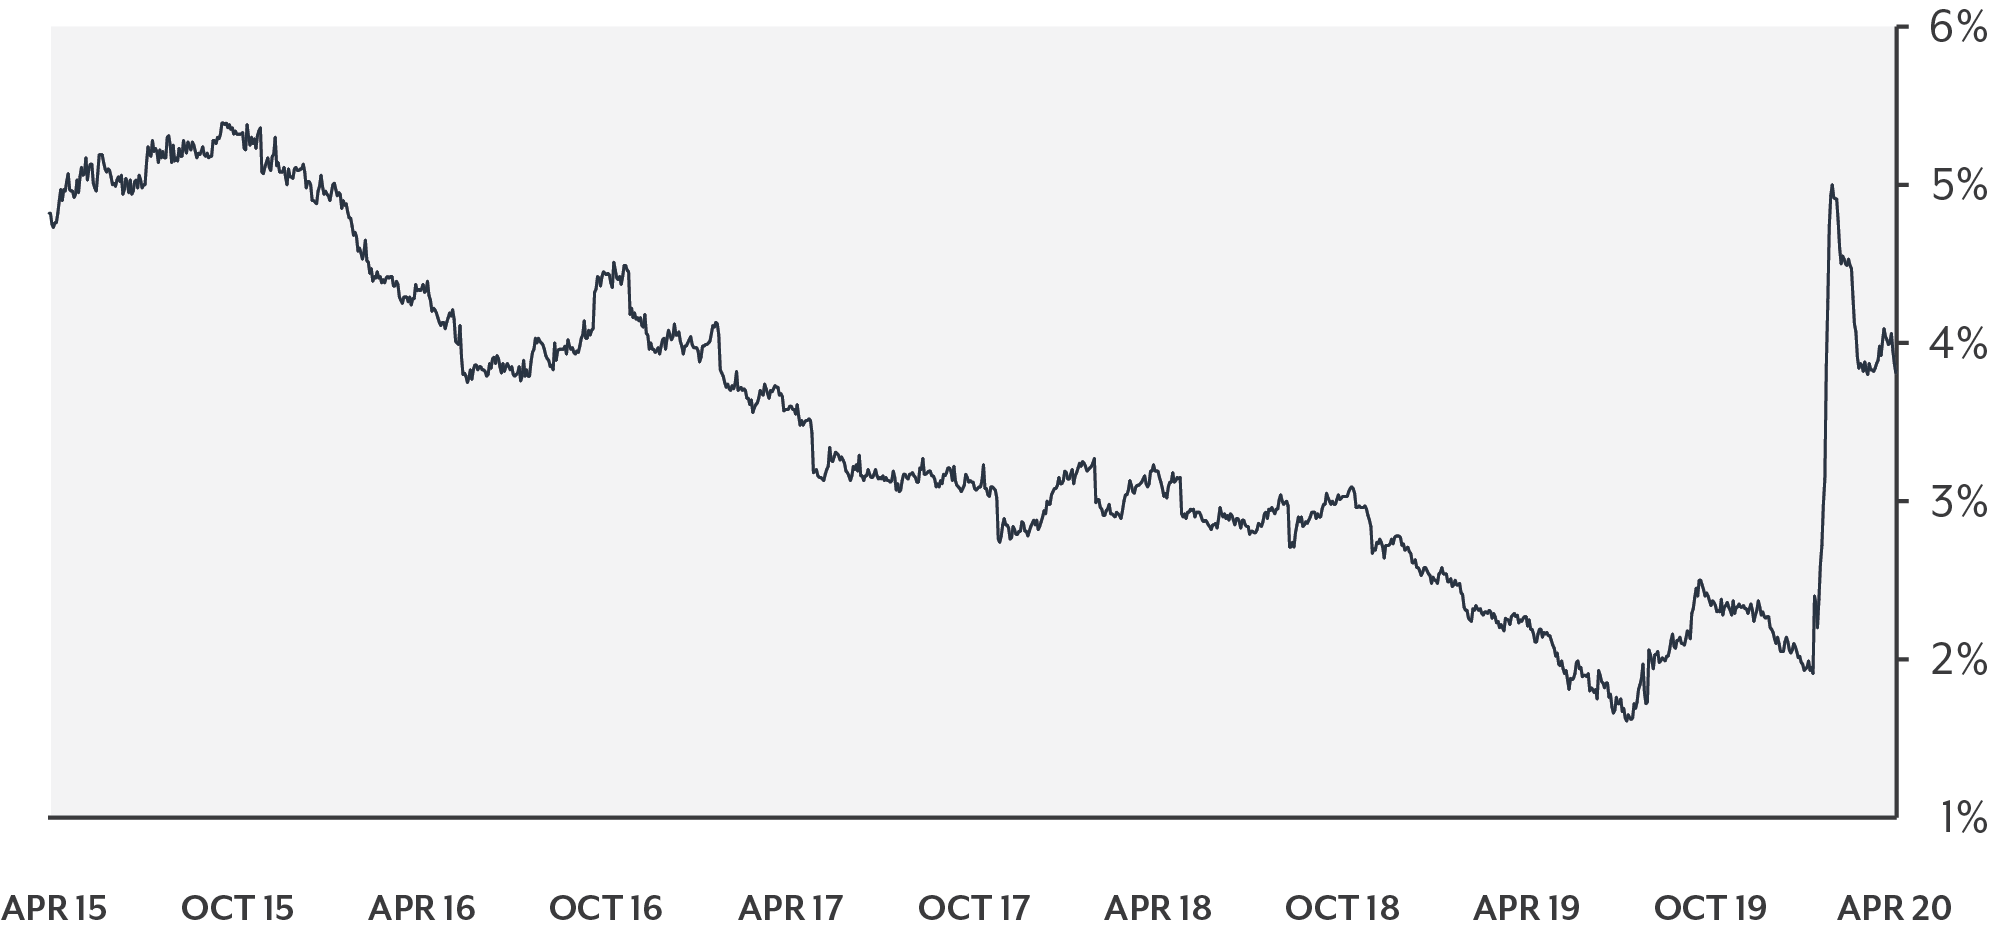
Moody's Seasoned Baa Corporate Bond Minus Federal Funds Rate
Non-Investment Grade Bonds
Credit spreads on non-investment grade bonds, also known as high-yield bonds, have widened because the pandemic and oil crash have created uncertainly about loan repayments. The known risks are priced in, allowing for an acceptable expected real return during this time period. It is important to be aware that high-yield debt is considered riskier than investment grade bonds, and therefore is more correlated with stocks than other types of bonds.
In 2019, MBM reduced exposure to high-yield bonds and shortened the average duration of remaining positions due to narrow credit spreads. The strategy will continue to focus on bonds with short-term maturities due to the elevated default risk across corporate issuers. Many of the lower-rated companies have the reserves to cover the loans over the short term but an extended decrease in revenue would be troublesome. Therefore, the risk-return tradeoff favors shorter maturities and broad industry exposure.
Over the past several years, MBM has sourced a range of investment-grade preferred stocks that have been added in place of high-yield bonds. Preferred stocks provide income similar to high-yield bonds and may also provide the ability to protect against rising interest rates in the future. Existing positions will be maintained as long as they meet criteria for inclusion in the strategy. New positions are not being added since most issuers are primarily in the financial services industry.
Municipal Income
Similar to taxable fixed income, investment-grade municipal bonds should be viewed more as a safety hedge and not a source of real return due to the low interest rates. However, we believe the probability of municipalities defaulting is substantially lower than that of corporate bonds. This enables MBM to take slightly increased duration and credit risk for higher returns. No changes are expected at this time.
Equity Strategies
Major stock indexes are a stone’s throw away from all-time highs after the recent market bounce. High unemployment, a fundamental shift in the economy, fear, and an expectation of poor second and third quarter earnings pose a large risk to stocks in the short term. Although a minor risk, a long-term economic shut down would pose a systemic risk to the economy as we know it.
We believe there is a 50/50 chance that the market lows in March are retested until more certainty is obtained. That being said, it is dangerous to fight the market stabilization efforts of the Federal Reserve and predicting government intervention is impossible. Many investors missed gains from 2008-2013 as monetary and fiscal policy boosted an economy and market that would not have done so otherwise. Traditional fundamentals have been abandoned, making tactical shifts to stock and bond ratios even more risky during a time when government intervention is high.
Although the short term is unpredictable, MBM’s Investment Committee has been tracking fundamental changes in consumer activity, corporate business plans, and investor sentiment for many years. These changes are accelerating, requiring a shift in investment approach to structure portfolios for the opportunity to capture higher risk-adjusted returns.
Consumers have shifted their purchasing behavior from the lowest-cost provider to the fastest and most convenient provider. In the post COVID-19 world, the safety and experience delivered by the provider will also be an important factor. Mega stores have been replaced by online shopping, home delivery services, curbside delivery, and small storefronts that provide a fast shopping option on the way home. Businesses will either adapt to this shift in behavior or lose market share and become obsolete. Those with nimble management teams are capitalizing on the changing consumer and are taking market share from legacy business models.
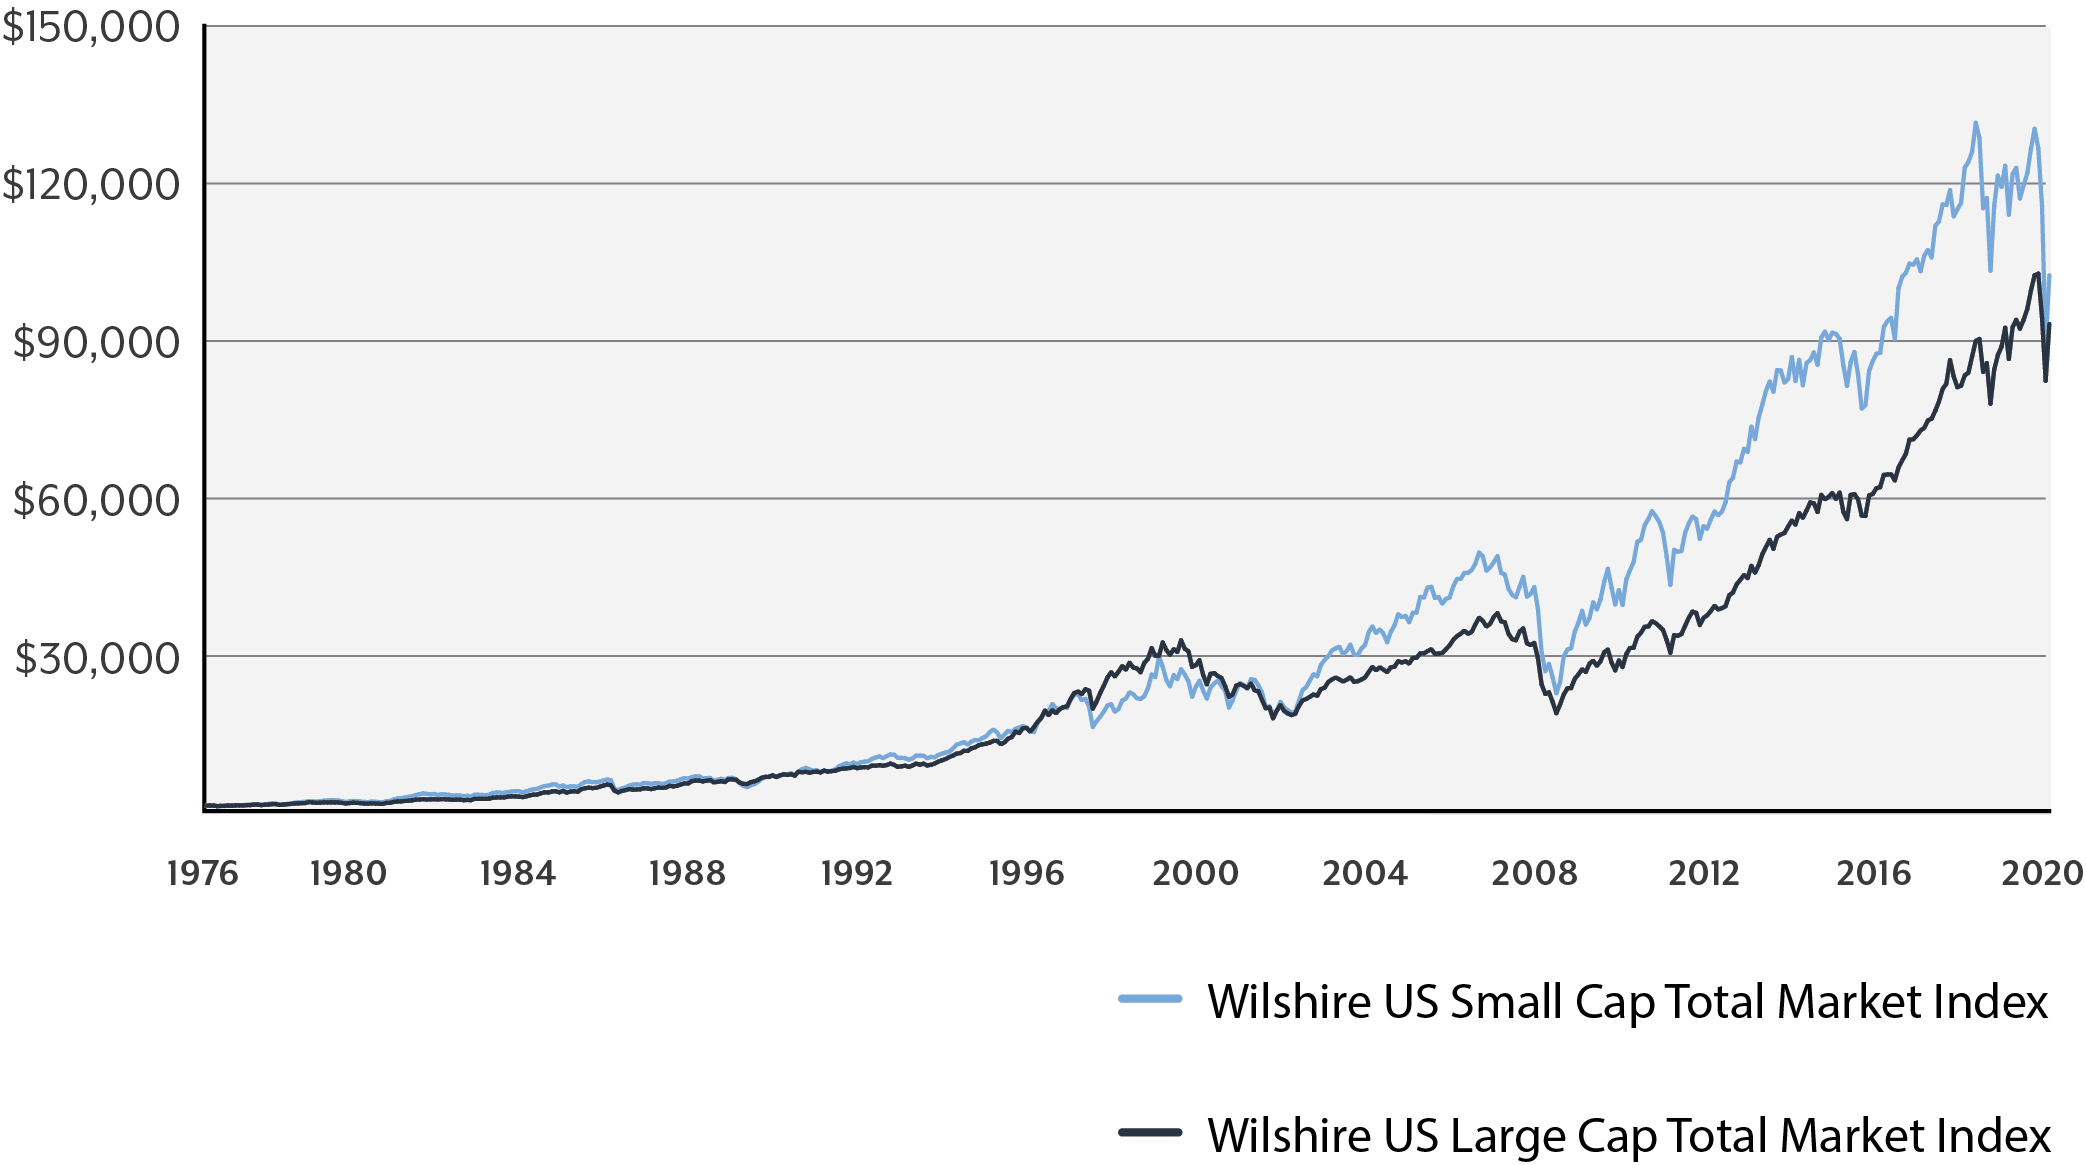
Investors are assigning a higher value to these disruptors. This continues a trend that has tilted the risk versus reward away from more traditional blue-chip stocks to higher growth stocks. Historically, investor perception is that value stocks perform better during a recession as investors have a flight to safety. This old adage did not prove true during the last recession that occurred between 2007-2009. Value stocks have also underperformed relative to growth stocks during the current recession. These companies have led the market on the downside, recovered slower, and have also trailed growth companies on the upside during economic expansion. Based on the exponential rate of change in our society, this trend has accelerated and will continue to do so.
Investors that are not adapting to this are losing investment returns and will continue to do so into the future. Warren Buffett, one of the greatest investors of all times, has repeatedly rejected the idea that investing in disruptors in favor of more traditional dividend-paying companies is necessary. This has been disastrous. From 1965 through 2018, Berkshire racked up a 20.5% compound annual return, more than double that of the S&P 500, including dividends. However, he has profoundly underperformed the S&P 500 Index throughout the entire 11-year bull market. MBM believes this trend will continue and will be adjusting portfolios accordingly.
Core Equity
A diversified approach will be continued; however, a tactical shift will be implemented to moderately overweight large-cap growth relative to large-cap value. Small-cap stocks historically lead market recoveries that eventually turn into the next bull market. With small-cap stocks trading almost 2.5 times lower than large-caps, the existing exposure will be increased. The fundamental flaws of the international markets exposed in 2008 have not been rectified and the recent correction confirmed that. The allocation to international stocks will continue to be kept underweight than that of a traditional portfolio.
Growth | Growth & Income
During Q2 2020, the Growth and Growth & Income strategies will be merged into a single strategy with the continued objective of delivering long-term growth of capital to clients through a diversified portfolio of individual equity securities. Our team employs a proprietary fundamentals-first, bottom-up approach to identify companies with strong or improving fundamentals with above-average earnings growth potential at an attractive valuation. Within each industry, stock selection will focus on dominant market leaders and disruptive companies gaining market share. As the disruptive companies continue to take market share from the leaders they are chasing, the exposure to them will grow and the leaders’ exposure will decline until they are eliminated entirely.
“It’s different this time” is a dangerous phrase for investors but so is ignoring fundamental shifts. The recent market correction and change in consumer behavior was the final confirmation of a trend that MBM’s Investment Committee has been monitoring. There are many reasons to be both bullish and bearish about the economy and stock market in the months to come. It is times like these that put investors to the test. As we have shared before, the best way for investors to weather the unknown lies in remaining disciplined, diversified and keeping your long-term asset allocation in line with your long-term investment objectives.
Your lead advisor will be discussing any portfolio improvements and tax strategies that have been implemented during upcoming review meetings.
If you are not a client of MBM Wealth Consultants, please contact us if you would like additional information about our investment strategies.
Lastly, thank you for the continued trust during these trying times. Stay safe, healthy, and connected!
Definitions
Asset Allocation – Implementation of an investment portfolio among different asset categories, such as stocks, bonds, and cash.
Bull Market – A bull market is a period of generally rising prices. The start of a bull market is marked by widespread pessimism. This point is when the “crowd” is the most “bearish”. The feeling of despondency changes to hope, “optimism”, and eventually euphoria, as the bull runs its course.
Bear Market – A bear market is a general decline in the stock market over a period of time. It includes a transition from high investor optimism to widespread investor fear and pessimism. One generally accepted measure of a bear market is a price decline of 20% or more over at least a two-month period.
Bond Duration – A measure of the sensitivity of the price of a bond or other debt instrument to a change in interest rates.
Bond Maturity – A specific date in the future where the bond face value must be repaid to the bondholder on that date.
Call Date – The call date is the date on which a bond can be redeemed before maturity. If the issuer feels there is a benefit to refinancing the issue, the bond may be redeemed on the call date at par or at a small premium to par.
Flat Yield Curve – A yield curve in which there is little difference between short-term and long-term rates for bonds of the same credit quality.
Investment Grade Debt – bonds or other debt instruments that carry low to medium credit risk.
Lagging Economic Indicator – Statistics that follow an economic event. You use them to confirm what has recently happened in the economy and establish a trend.
Leading Economic Indicator – Statistics that precede economic events. They predict the next phase of the business cycle.
Systemic Risk – The possibility that an event could trigger severe instability or collapse an entire industry or economy.
References
1. https://www.investopedia.com/terms/b/blackswan.asp.
2. https://www.cnbc.com/2020/03/23/this-was-the-fastest-30percent-stock-market-decline-ever.html
3. Hartford Funds “A Health Epidemic Doesn’t Have to Mean Market Contagion”, April 2020. https://www.hartfordfunds.com/dam/en/docs/pub/whitepapers/CCWP070.pdf City National Rochdale March 2020 Commentary – Economic & Market Perspectives; https://www.cnr.com/insights/economic-perspectives/economic-and-market-perspectives-mar-2020.html.
4.https://en.wikipedia.org/wiki/2020_Russia%E2%80%93Saudi_Arabia_oil_price_war
5. First Trust Portfolios LP; “History of U.S. Bear & Bull Markets – April 2020” www.ftportfolios.com
6. First Trust Portfolios LP; “The Probability of Positive Returns; S&P 500 Index: 12/31/1936 to 12/31/2019”. www.ftportfolios.com


